Twitter question - Standard deviation I hear you say?!
We recently received a set of questions on Twitter about how we check repeatability of both the GoingStick hardware and its operation on a racecourse.
Questions like this are great, we are always open to discussion with our followers on these topics, but felt a simple tweet reply wouldn't have "cut it".
We wanted to answer this question in as much detail as possible, in order to give full clarity to the community and also to convey the effectiveness of the GoingStick as a measuring tool for this fantastic sport and many others.
Laboratory Testing and Calibration
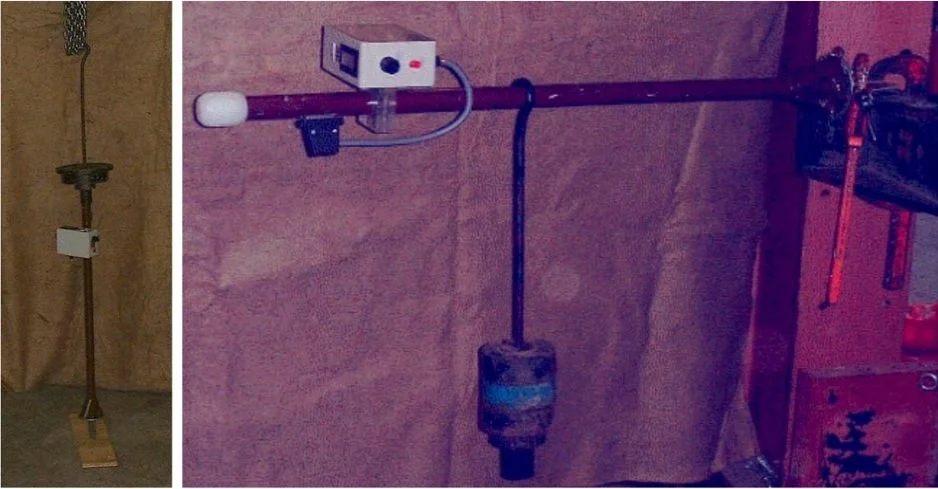
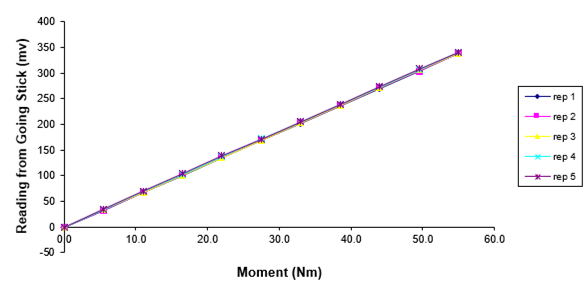
In 2001 the first ever prototype of what became the GoingStick (pictured) was tested using a system of weights and measures to produce known forces on the probe, the process was replicated many times to ensure accuracy and repeatability of those measurements.
The graph below is one of the very first tests demonstrating repeatability for shear measurements, the same was produced for penetration.
We still use a version of this process today to calibrate new units and service those in use, the advice to users is to have an annual calibration.
In 2003, the 4th iteration and first production model of the GoingStick (example pictured below left) was sent for independent commissioning tests at Cranfiled University.
These tests were carried out using uniform soil preparation prepared with machinery that can compact soil to the same density within a small defined area (see image above right).
Here are values produced during commissioning tests;
Preparation type: Mean GoingStick index: Standard Deviation:
Firm/Hard’ 10.3 1.60
‘Intermediate’ 7.7 1.37
‘Soft/Heavy’ 2.7 1.09
Multiple units and multiple users were tested - differences were negligible.
Practical Use
In practical use, on a racecourse, it is impossible to push 2 GoingSticks into the same hole and even when testing in a relatively small area the GoingSticks (and any other turf measurement such as soil moisture % tests) show levels of natural variability in the turf/soil.
If you keep using the same area to test the ground becomes disturbed and this will affect the readings produced.
So with this in mind, we test new GoingSticks using a similar area on a local racecourse that is as uniform as possible.
We conduct the test multiple times with 20-30 repetitions, each with 3 x penetration an 3 x shear.
Typically the average GS reading is within 0.2 and SD is between 0.7 and 0.9 on a uniform area and similar between different fully trained users.
Different Sticks and Different Users
We have tested more practically what different sticks and users will produce as an average (the BHA requirement) by walking a full circuit of a racecourse with multiple users and sticks.
The graph below shows 4 users using different GoingSticks taking 40 readings around approximately a 2-mile circuit.
The graph speaks for itself, the GS averages and SD are on the graph and reproduced here;
User 1 GS 5.2 SD 1.93
User 2 GS 5.5 SD 1.90
User 3 GS 5.6 SD 1.69
User 4 GS 5.6 SD 1.87
During the test, we purposely targeted some firmer areas that would not typically be used for racing e.g. waypoints 4 & 6.
The 4 users remained close to each other early on during the test, then towards the end of walk there was a bit of ‘wandering’ (commonplace with multiple users!), you can see this in the data on the graph.
In other words, small differences in index values tend to be because of testing different areas/racing line and not because of stick or user.
Our Approach to Testing
We have conducted many many tests like this over the years and continue to do so when for example;
We commission newly manufactured GoingSticks
We conduct training or ‘refresher’ sessions for new users
We are asked to test how an individual GoingStick and or user is performing
We produce individual analysis for penetration and shear values and use this to help with improving user technique when needed.
Below is a test across a 1 ½ mile circuit, but the users walked the course separately about 1 hour apart one user had very recently been trained. The same areas were tested by referencing a map and numbers on running rail and waypoint grids for each test area range from 50-70 metres so there will be some natural variability in the turf.
This test was conducted on a race day morning.
User 1 GS 5.7 SD 0.63
User 2 GS 5.5 SD 0.88
Best Practice
The industry is provided with a ‘best practice’ user guide with many pointers, but for example each course is advised to have one or two designated users trained by TurfTrax and that readings are taken in the same location each time.
Following the guidelines means the best repeatability of results and data for historic analysis.
GoingSticks should also be calibrated at an approved service centre annually.
Isn’t it fantastic that the industry has a tool available that can be used to measure ground conditions and analyse the data to compare user technique? This would be very difficult to achieve with a wooden stick!
The version 2 GoingStick that is currently in development will have added functionality that will increase the consistency of data collection and analysis across all users and venues
If you'd be interested in learning more about that or any other TurfTrax products, please get in touch:
W: www.turftrax.com
T. +44(0)1480 408970
E. turftrax@turftrax.co.uk


